Have you ever watched a child drop a leaf into a stream and follow it with their eyes as it curves around a rock? That tiny observation is the beginning of understanding ocean currents – except the ocean is billions of times bigger, and the currents circle the entire planet.
Why Ocean Currents Matter (Even for Imaginary Islands)
Ocean currents are like Earth’s circulatory system. They move heat from the equator to the poles, shape the weather, and bring nutrients to sea life. Without currents, the equator would be scorching hot, and the poles would be even colder – and most marine life would starve.
When a child builds an Imaginary Island, they usually think about mountains and rivers. But what about the ocean around it? Is it warm or cold? Does a current flow past? Is there an upwelling that makes fishing good? These questions turn a simple clay project into a deep science lesson.
The Science in Simple Steps
Here’s what happens, step by step:
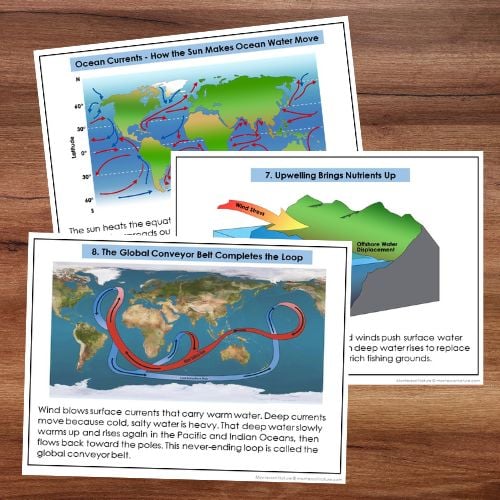
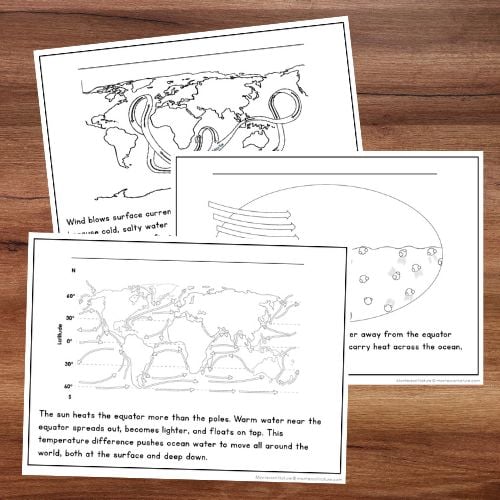
- The sun heats the equator more than the poles. Warm water near the equator spreads out and floats.
- Evaporation makes water saltier. In the tropics, water vapor rises, leaving salt behind. Salty water is heavier.
- Wind pushes surface water away from the equator toward the poles, carrying heat.
- Earth’s spin curves the currents – right in the north, left in the south (Coriolis effect).
- At the poles, water cools and sea ice forms. Ice pushes salt out (brine rejection), making the leftover water very cold, very salty, and very heavy.
- That heavy water sinks to the bottom, mainly in the North Atlantic and near Antarctica.
- The deep water spreads along the ocean floor toward the equator.
- Upwelling happens where deep currents hit continents and winds push surface water away – cold, nutrient‑rich water rises, feeding fish.
- The deep water slowly warms and rises again in the Pacific and Indian Oceans, then flows back toward the poles. This never‑ending loop is the global conveyor belt.
- Every few years, El Niño slows upwelling in the Pacific, changing weather worldwide.
Hands‑On Science Activities for Ages 6–9
Activity 1: Warm Water Floats, Cold Water Sinks
What you need: Two clear glasses, hot water, cold water, red and blue food coloring.
What to do: Fill one glass with hot water (add red dye) and one with cold water (add blue). Place a card over the red glass, invert it, and carefully set it on top of the blue glass. Slowly slide out the card. The red (warm) water stays on top – warm water is lighter.
Ask: “What happens at the equator where water is warm?” (It floats on top.)
Activity 2: Make Your Own Density Current
What you need: Two glasses, water, salt, blue food coloring, a spoon.
What to do: Fill one glass with cold water and add 2 tablespoons of salt and blue dye. Fill the other with plain warm water. Slowly pour the blue (salty) water into the plain water. The blue water sinks – it’s denser.
Ask: “Why does salty water sink?” (Salt makes it heavier.)
Activity 3: Spin and Curve
What you need: A lazy Susan or a turntable, a small amount of water, a dropper.
What to do: Place a thin layer of water on the turntable. Spin it slowly. Drop a tiny amount of food coloring into the water. Watch it curve to the right (if spinning counter‑clockwise) – that’s the Coriolis effect in action.
Ask: “Why do ocean currents go in circles instead of straight lines?” (Earth’s spin pushes them sideways.)
Hands‑On Science Activities for Ages 9–12
Activity 4: Brine Rejection – Ice Leaves Salt Behind
What you need: A small plastic container, water, salt, a freezer, two bowls.
What to do: Fill the container with very salty water. Freeze it. When it’s solid, take it out. Let it melt slightly. Taste the melted water – it’s not very salty! The salt was pushed out during freezing. That salty brine sinks.
Discuss: “Why does sea ice make the surrounding ocean saltier and heavier?” (Ice crystals push salt out – brine rejection.)
Activity 5: Model the Global Conveyor Belt
What you need: A long clear plastic box, cold salty water (blue), warm fresh water (red), a divider.
What to do: Place the divider in the middle. Fill one side with cold salty water (blue), the other with warm fresh water (red). Remove the divider. Watch the blue water slide along the bottom to the other side, while red water flows along the top back. That’s a mini conveyor belt!
Discuss: “Where does deep water form in the real ocean?” (North Atlantic and near Antarctica.)
Activity 6: El Niño in a Pan
What you need: A baking pan, water, a fan, a small barrier.
What to do: Fill the pan with water. Use a fan to blow across the surface from one end (normal winds). Notice how surface water piles up at the far end. Then turn off the fan – that “stops” the wind, like El Niño. The piled‑up water sloshes back.
Discuss: “How does El Niño change weather in the Pacific?” (Warm water spreads east, causing floods in some places and droughts in others.)
How the Printable Resource Brings It All Together
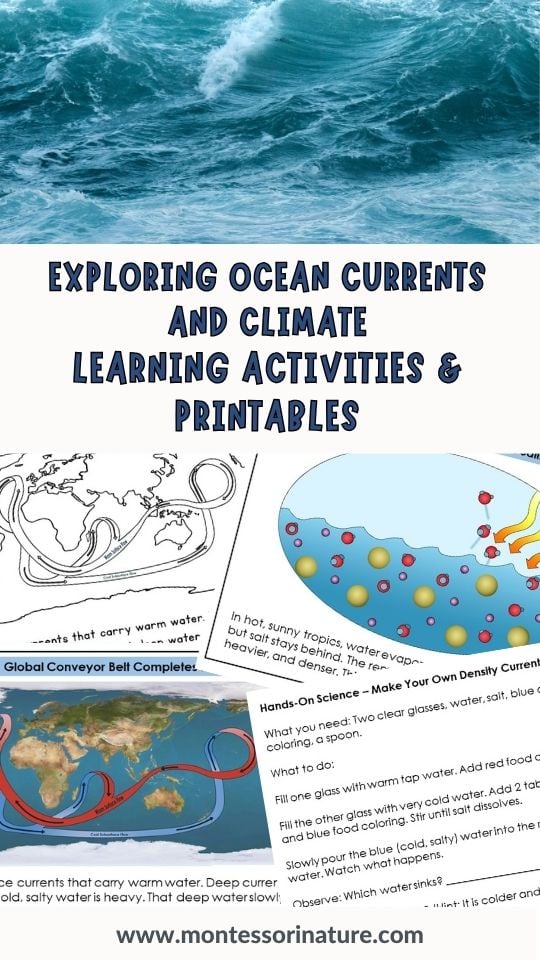
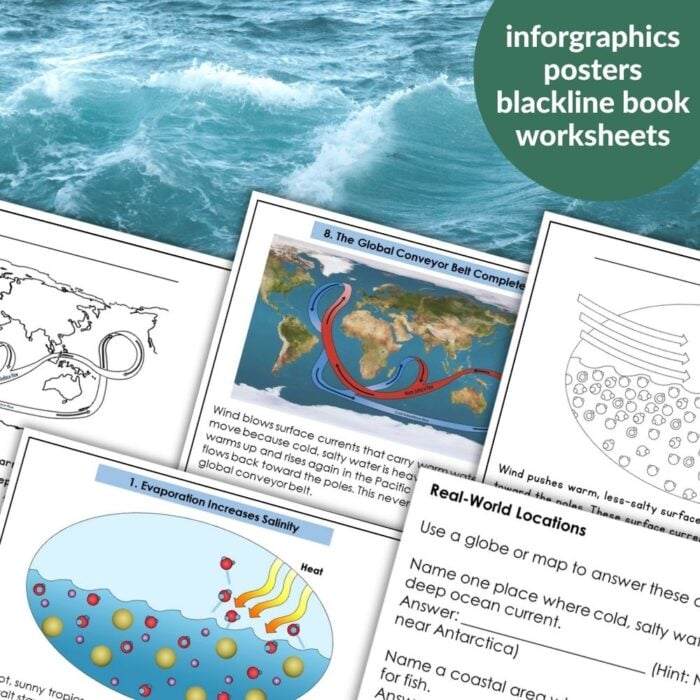
Teaching ten ocean current processes with multiple hands‑on activities can feel overwhelming. That’s why I created a set of 10 infographic posters – one for each step above.
What’s inside:
Full‑page color posters with simple diagrams and 45‑word explanations
Black‑and‑white versions for easy printing
Small card versions (2, 4, or 6 per sheet) for matching, sequencing, and notebooks
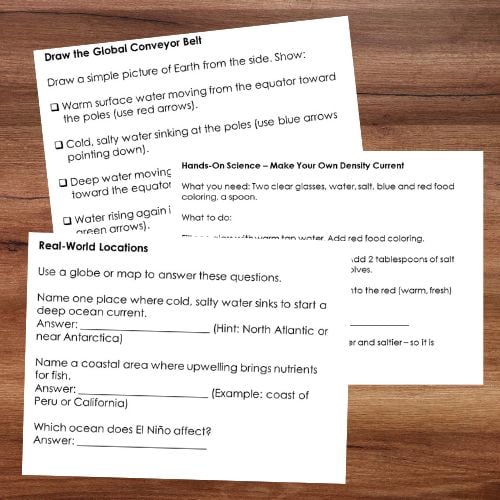
A student research worksheet (with answer key) that includes the density experiment and real‑world questions
Teacher guide with age‑specific recommendations
How to use it:
Ages 6–9: Display one or two posters per week. Read aloud. Do the matching game with small cards. Add a warm current arrow to their Imaginary Island.
Ages 9–12: Bind the full posters into a reference book. Have children sequence the small cards in the correct order. Complete the research worksheet. For the Imaginary Island, a written ocean current report is required.
Why it works: The posters are visual, sequential, and self‑explanatory. Children can work independently, and the hands‑on activities (density experiment, brine rejection, conveyor belt model) make the science real.
Here is what a discovery process might look like in a classroom:
“My island is at 45°N, so it’s in the North Atlantic,” said Leo, pointing to his salt‑dough map. “That means cold, salty water sinks near here – that’s the start of the global conveyor belt.”
He pulled out the “Cold, salty water sinks” poster from our ring‑bound book. “And upwelling will happen here on the west coast because the wind pushes surface water away.”
That moment – when a child connects a real ocean process to their imaginary world – is why I love teaching this way.
Ocean currents are invisible, powerful, and absolutely fascinating. With a few simple experiments – warm water floating, salty water sinking, ice pushing out brine – children can see these forces with their own eyes. And when they apply that knowledge to their own Imaginary Island, they become oceanographers in their own right.

Ocean Currents and Climate
Help your students discover how ocean currents shape climate around the world – from the sun‑drenched equator to the freezing poles. This Montessori-inspired printable explains key processes. Perfect for the Imaginary Island project, this resource guides children to design realistic ocean currents around their island based on its location.
This printable is also available on TPT
You Might Also Enjoy
-
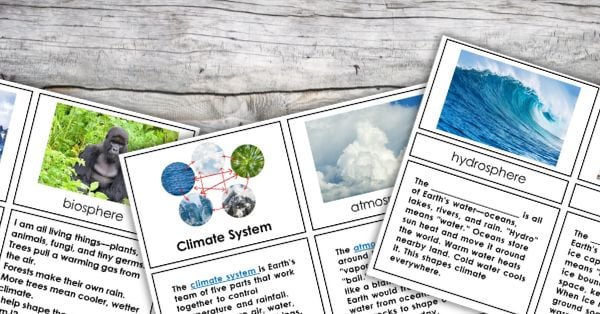
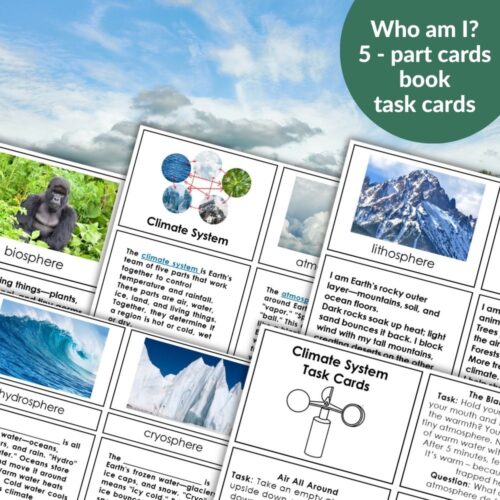
 Earth’s Climate System$3.50
 -
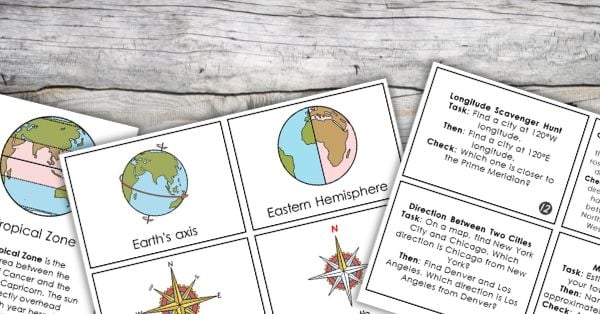
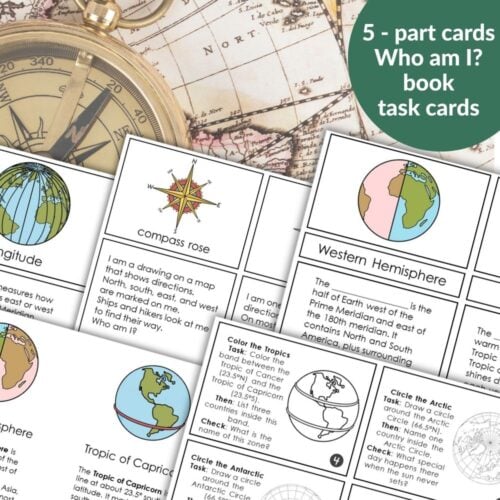
Latitude and Longitude: Geographic Coordinate System$7.00
-
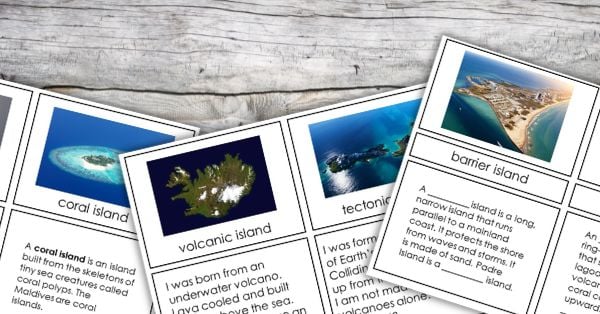
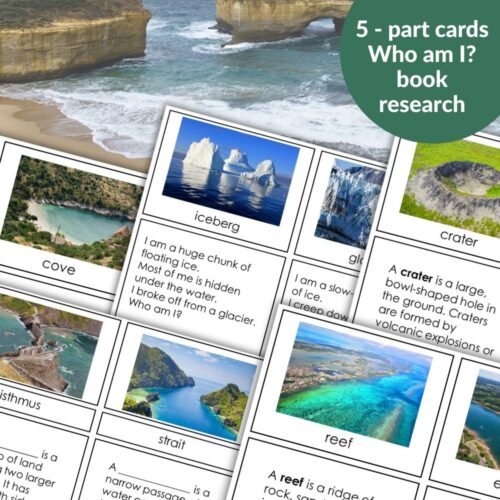
Inland and Coastal Features$8.00
-
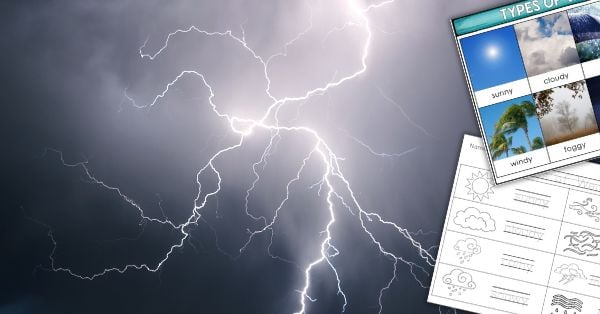
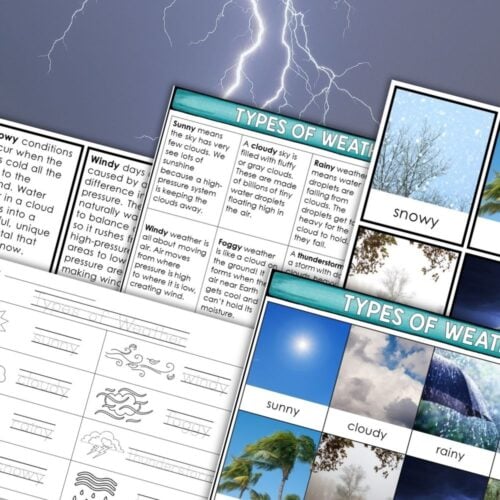
Types of Weather: 3-Part Cards Descriptions Worksheets$4.50
-
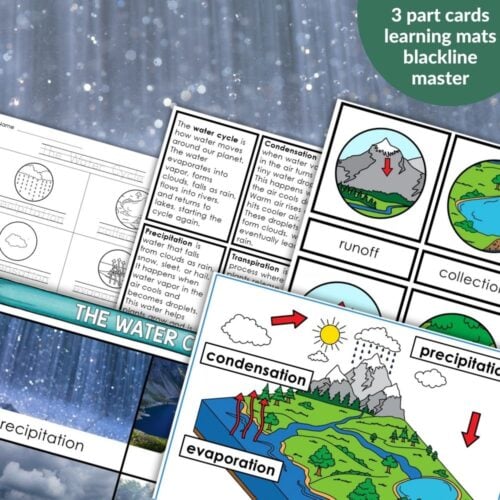
Water Cycle: 3 Part Cards Blackline Master Diagrams$4.30
-
Types of Clouds: 3 Part Cards Cloud Identifier Weather Report$4.80

About Anastasia | Anastasia is a certified early childhood teacher with over twenty years of experience in Montessori classrooms and homeschooling. As the founder of Montessori Nature, she creates evidence-based, nature-inspired educational printables. Discover more resources on her blog and Teachers Pay Teachers store.